Nothing could say it more clearly than the above song - like most macro guys I have been pulling the few hairs I got left out my head in this first quarter, but I think finally I see clearly now:
This is not similar to the past - GDP has exploded!
Economists, both the good, the bad and the ugly, does the same mistake again and again: When trying to guestimate the economy they project forward the recent past - basically all economist's are momentum traders: If the last two quarters are positive - they expect the next quarter to be even more positive and from this comes forecasts which NEVER turns out right.
I remember as a young trader in London how one particular client of us, in the "bar" business, called up the ten biggest FX banks and asked them for their forecast of the three main currencies end of next quarter. They compiled the results and if - the consensus was more than 70% to one side - they took......the opposite side! They claimed to have made in excess of 30% p.a on this!
After projecting the recent data forward, the economist' of today, then look at prior historic data to find analogies. This is called: Counting. Combining momentum and counting gives you: NO VISIBILITY but a consensus view.
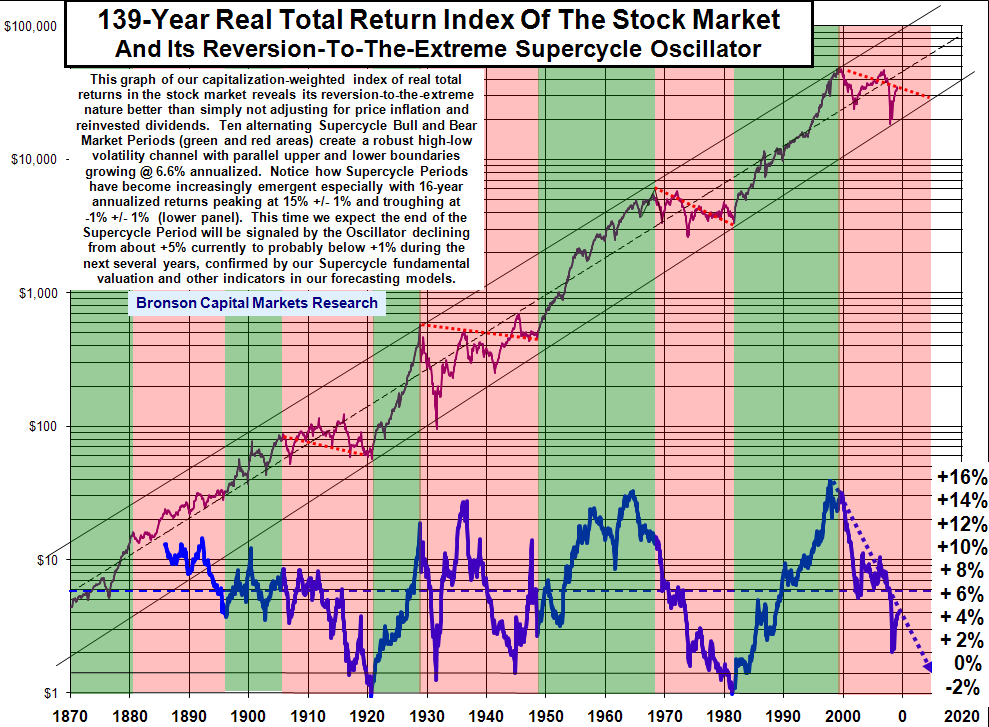
Explain to me how this below chart can be compared to anything in history before:
...and does this looks like a "normal story" - The US monetary base:
This is the exact problem of almost all the major investment banks - in order to safeguard themselves they use the above method despite the fact they know of the above chart.
Again - if anyone of you are able to explain to me, how you can compare todays DEBT BURDEN to any prior experience be my guest: Just for the sake of it: By 2020 the Federal Debt in the US will be 90% of the nation output accroding to the Congressional Budget Office:
Link to article
There is major divergence in the world right now: Europe on the brink of deflation, Japan in deflation, EMG in inflation, and the US......nowhere
Investors fail so far to acknowledge how weak the European recovery is - the Greece crisis and the focus on sovereign debt and fiscal deficits still haven't got people to think clearly - yet!
However there are clear signs from REAL MONEY investors are beginning to move their feet away from Europe - State Street runs one of the best surveys on actual flow called a regime mapping: Despite recent stock market recovery their overall them remains: RIOT! More importantly though there is massive lack of appetite for EMG risk:
The chart above show the flow as measure in percentages. High number mean high inflow and vice-versa.
I fail to understand how EMG risk coming of as being a good sign for the world GDP and stock markets? Never the less, there are plenty of people advising me to buy developed risk and sell EMG risk.
Let me put it this way: I would rather die than follow that advise. Do you really think I should buy over-indebted US, Europe and UK risk and sell Singapore, Brazil, China against it?
People must have lost their heads. EMG is already underperforming if anything - I would buy it relative to developed! Tossers!
There seems to be little focus on the fact that broad money in Europe is NEGATIVE:
Ouch! Europe is on the brink of DEFLATION! The non-solution in Greece is going to get investors nervous past the month-end, quarter-end manipulation of stocks.
The fact remains that Greece vs Germany still trades at > +300 bps - and that there are no solutions. Wait for Spains, Portugals, and Italys CDS' to widen and soon.....
Meanwhile in the US - inflation apperently is coming ? Que? I am confused - how can an economy with rising unemployment, output gap, rising saving rates, and collapsing credit be in inflation environment? My good friends in Soc. Gen has nice chart to illustrate this is indeed the case:
The new "cash on the sideline" comment is being replaced by: Money Market funds are seing outflow - this means HIGHER EQUITY! Ok - ok...
But hang on ? Who says so? IF - rates going higher clearly it will be more interesting to keep them in money market ? No ? Could it be people are using the funds to other things? Keeping their business alive? I doubt this is new flow, but then again I am always wrong.
To my own surprise there is positive correlation btw USDJPY and Nikkei, which makes one consider to be more long USDJPY. Let me also say this: Soc. Gen got some of the best macro analysis on the street - the last two chart where from their reports this morning.
How does this all add up?
1. The momentum + counting overestimates the real economy. It ignores the levels and math involved - hence there will be disappointment in the incoming data relative to reality. It also makes people allocate to risk at the peak of the cycle as everthing an economists does it history. This is the highest confidence I have seen in the odd 25 different banks research I read - even the bears among have given up!
This is potentially cycle top for growth and rates.
2. Absolute DEBT matters. Despite several Nobel economist' and other theory on this - we have NEVER seen the capitalistic system this leveraged in terms of debt. The reason for high savings in private+ corporate world is the mere flip side of the sovereign indebtness.
Economist's seems to forget a rise in public debt de facto has to be met by an equivalent rise in private savings. That's the reason for big cash reserves among corporates and private. Not because they need to invest them!
3. Divergence matter. Market is busy embracing the positive effects of globalisation when its positive for the spin - now, however, EMG risk is falling and inflows at lows - then thats also positive? C'MON! If China and EMG are facing tighter monetary policy it will be NET DRAG on growth - FORGET ABOUT selling EMG vs develop. Will be biggest losing trade in history. You don't fade gravity!
4. Inflation or not inflation ? I remain sceptical of US and European inflation talks but I do respect the recent break to the upside in 10 YR US Treasuty yield and the more surprising fact that 10 YR SWAPS trades through 10 YR Treasury and I am carefully watching: What FED's exit from emergency credit facilities (MBS and Agency DEBT) on March 31st will do to the credit and yields.
Strategy:
Our Cycle model sold S&P on Friday open - we remain with this.
We want to sell inflation risk in Europe/US and buy it in EMG.
We want to be long Nikkei vs DAX/STOXX50
We are long USDJPY - short EURUSD
We are short 10 YR Treasury.
We are short REITS : DRV
Bought DAX puts today.
Plenty of cash in the account - no one the sideline..
Well,
I will retire for the day and drink my favourite Champagne as only a Winston Churchill can do it!
Winston
.jpg)


 Posts
Posts